

Understanding cryptocurrency charts might be difficult, but it’s key to being a successful trader. If you have stepped into the world of crypto, knowing the current value of bitcoin will not be enough, charts are an important tool for making trading decisions.
A full understanding of what a chart shows as well as the information that it provides is imperative to trading. There are three main chart types that are popular among traders — line charts, bar charts, and candlestick charts.
Line Charts
This is the most fundamental chart you’ll find when you start cryptocurrency trading. The stepping stone for a beginner, it presents a simple progression of the cryptocurrency you’re trading over a period.
The line can track different aspects of the market share and price. Studying them will give you an idea of how the price of the coin has changed over time.
These charts usually allow having an overview of the coin’s performance for a month, a week, a day, or even in the last hour. These simple linear graphics are good for a general insight into the price over time.
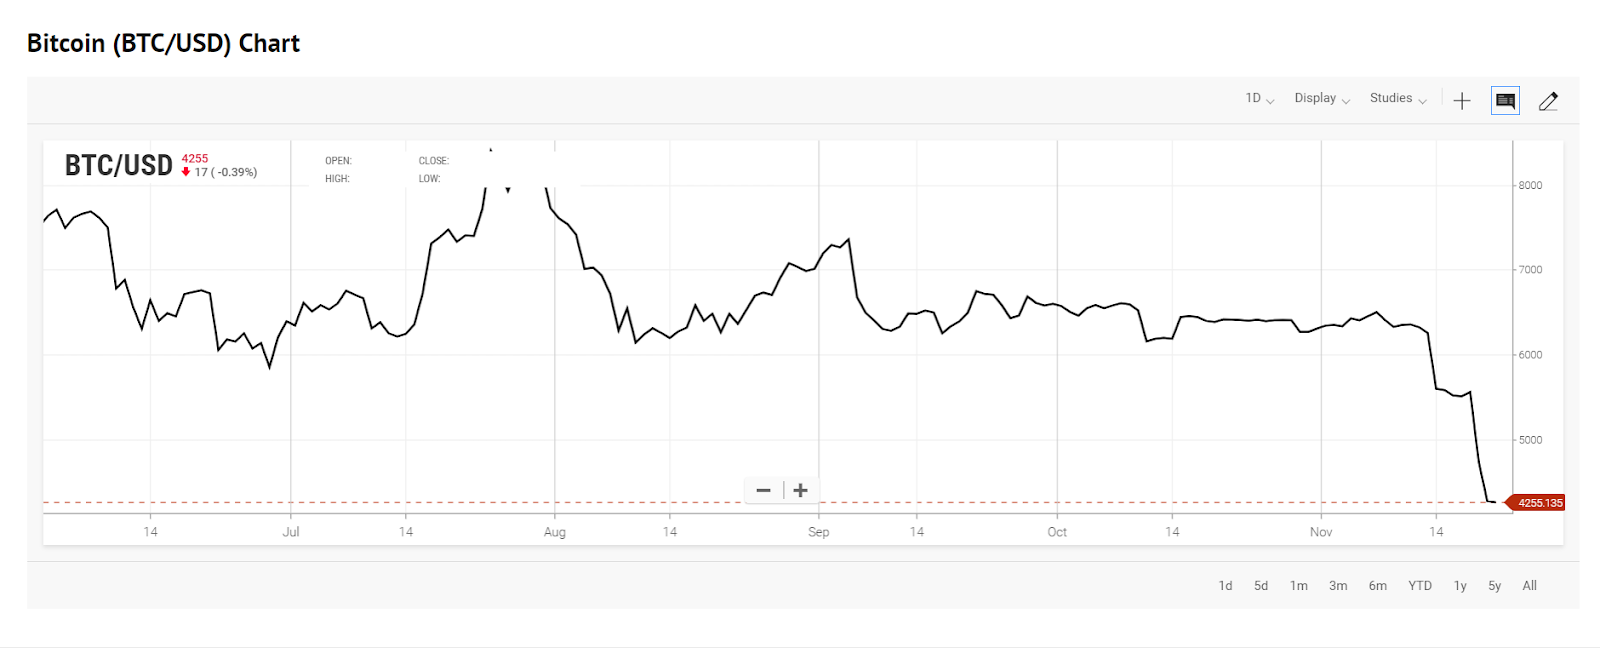
The above chart by Ihodl.com presents the price of bitcoin in USD. It also displays the opening price, the closing price, the lowest and the highest price over the selected time period.
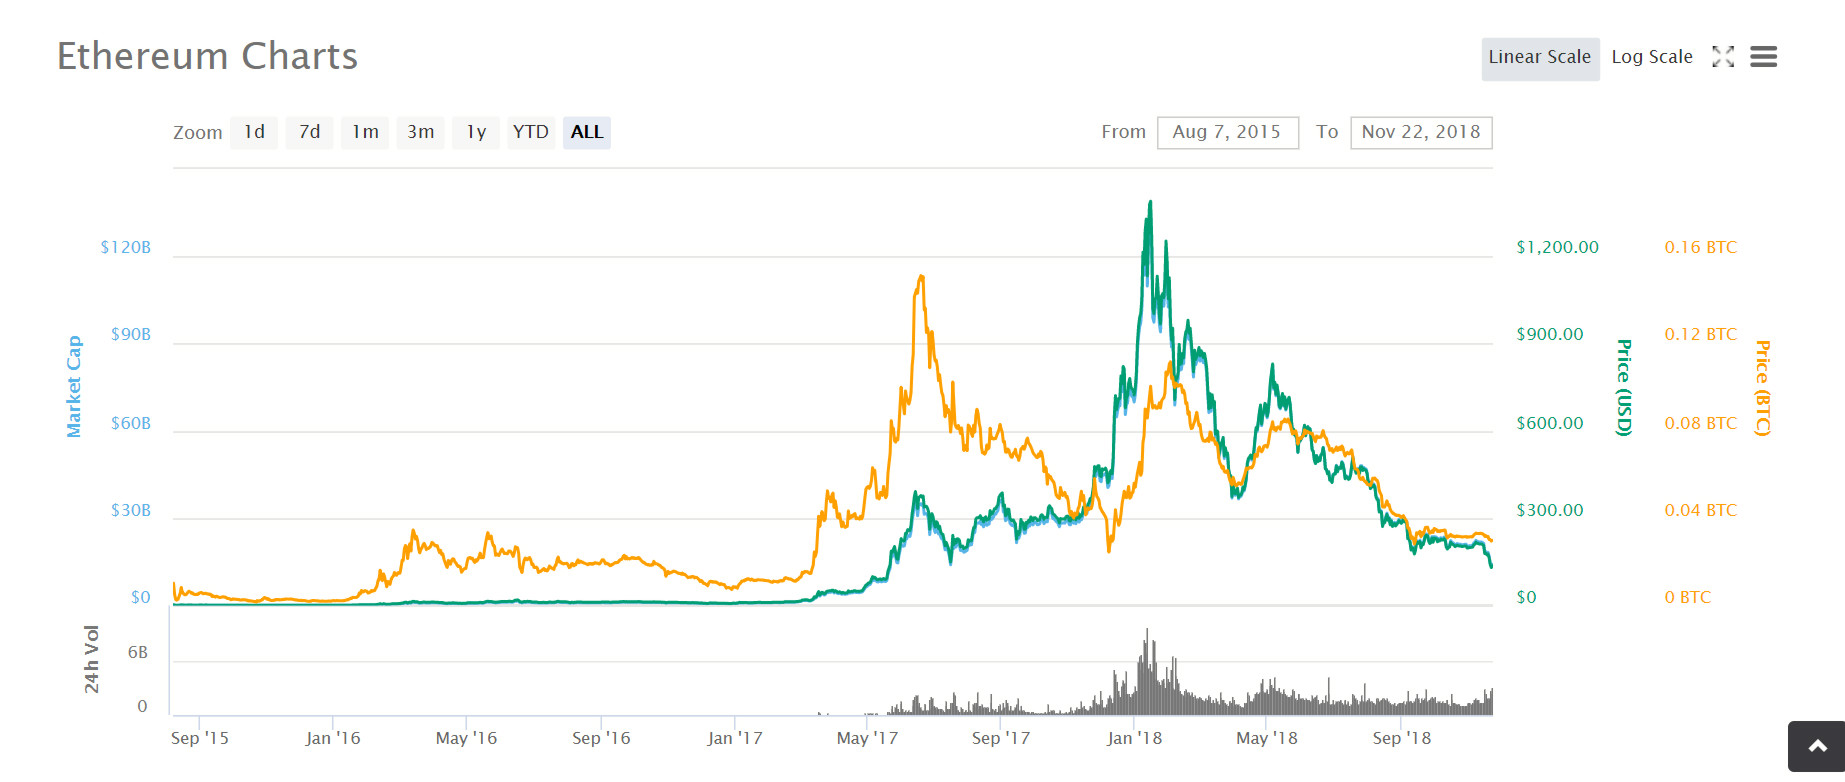
A similar chart on popular price tracker CoinMarketCap.com will also give insight into each coin’s market cap, its price in USD and bitcoin, as well as the 24-hour trading volume.
Bar charts
Bar charts are more useful to cryptocurrency traders and investors. They are made of vertical lines and small horizontal dashes. Ihodl.com provides two types of bar charts — simple and colored. Let’s look at the colored chart with green or red bars.
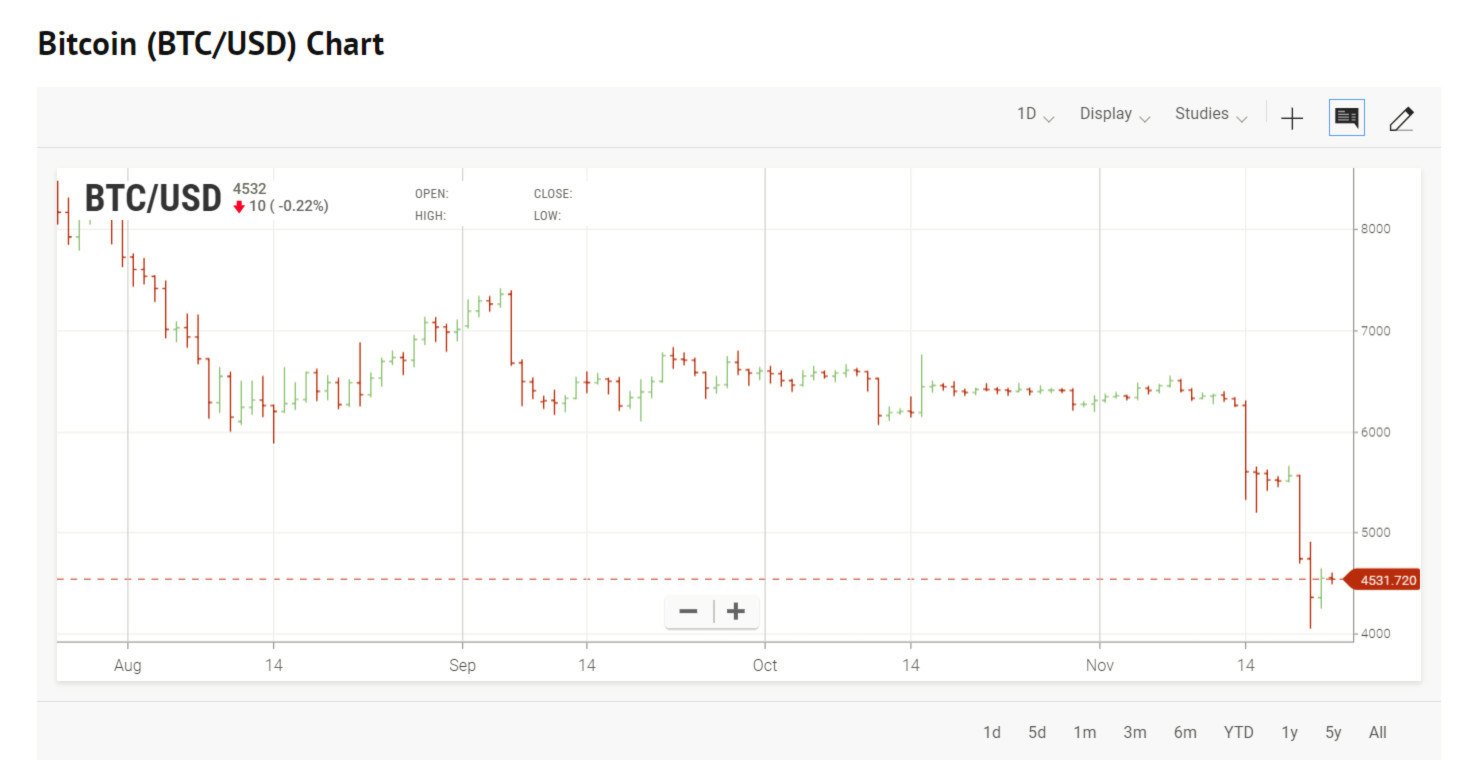
The highest point of the vertical line here represents the high price and the lowest stands for the low price within a specific time frame.
The dash at the left specifies the opening price and the one at the right indicates the closing one in the given period of time. Understanding this chart is simple: if the left dash is lower than the right dash, then the bar is shaded in green and indicates a price increase. The decreased value is colored red.
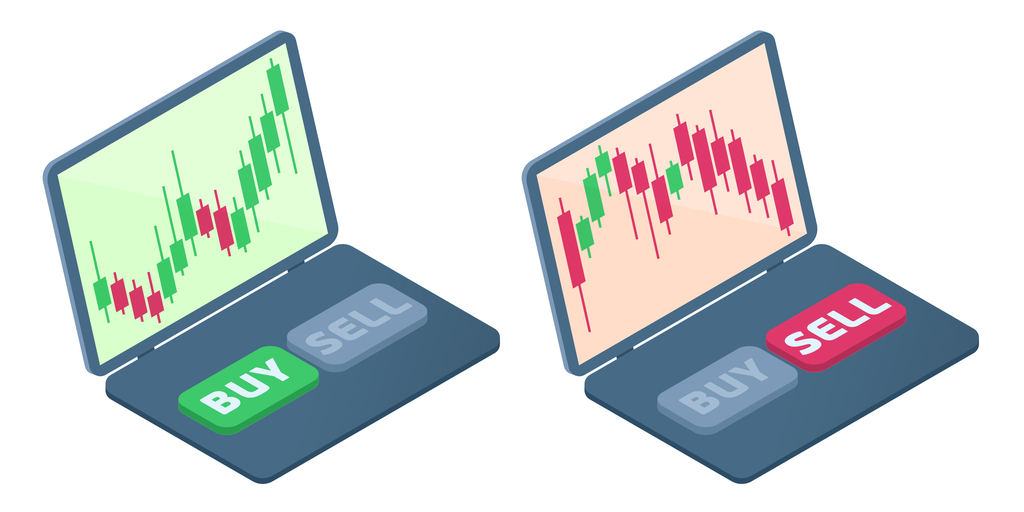
Candlestick charts
A candlestick chart (also called Japanese candlestick chart) is a style of financial chart used to describe price movements of a security, derivative, or currency. Each ‘candlestick’ typically shows one day.
Steve Nison brought candlestick patterns to the Western world in his popular 1991 book, "Japanese Candlestick Charting Techniques."
Candlestick price charts are the most popular ones among cryptocurrency traders. The charts are intended for more advanced traders, but it really isn’t that hard to understand those.
Each ‘candle’ in the chart shows the opening price, the lowest and highest price of the given time period as well as the closing price.
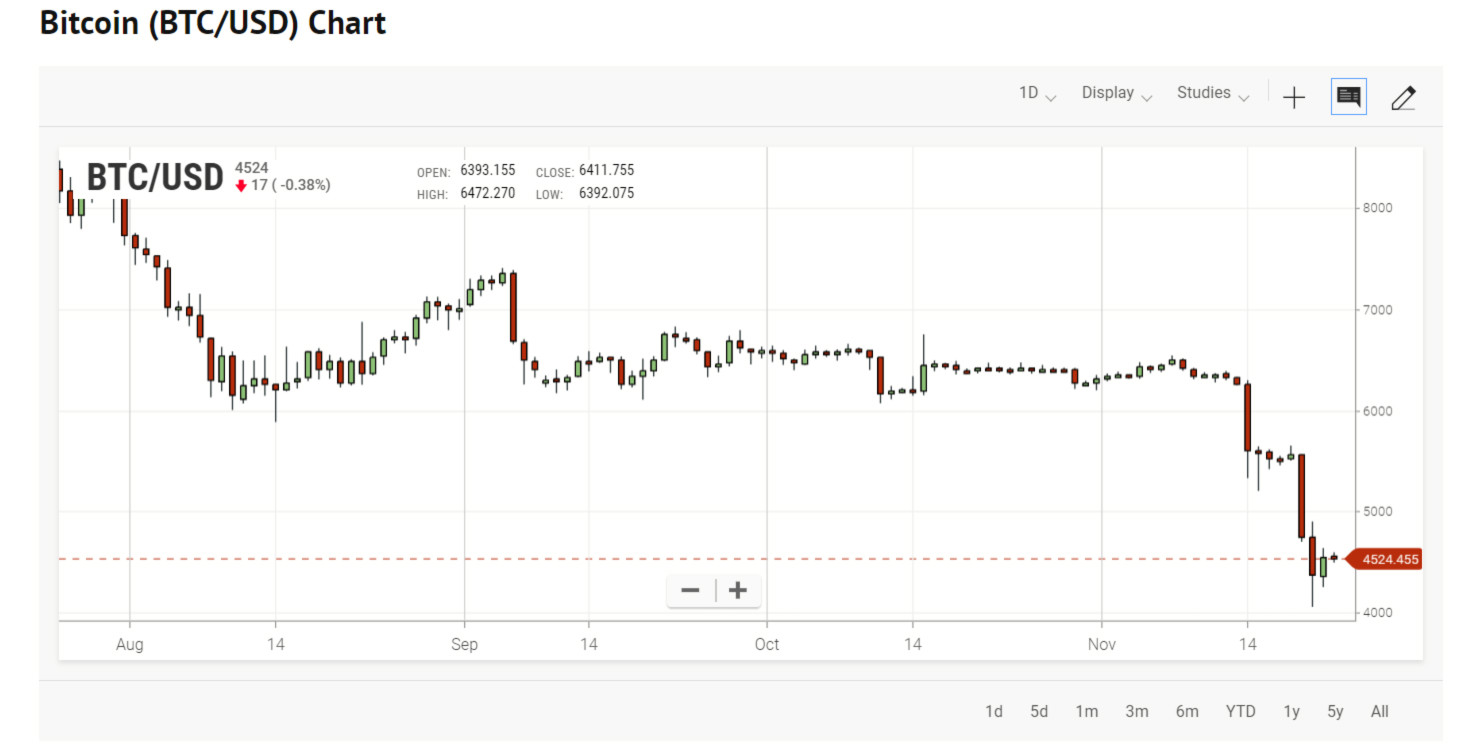
The size and color of the body, the length of the shadows is very important as they reveal current trends, reversals, and future price movements.
The color of the candle indicates whether the closing price was higher than the opening price (usually represented in green) or lower than the opening price (in most cases shown in red). Green candles are called ‘up-bars’, and the red ones are known as ‘down-bars’.
The ‘wickers’ or the thin lines displayed above and below each candle indicate the lowest and highest price during the selected time period.
Now that you know how to read cryptocurrency charts, go and follow the trends on daily basis. These graphs are helpful for a snapshot view of what’s been going on with a digital currency, so you know if it’s on an up-trend, down-trend, or moving sideways.
However, price analysis is only one piece of the puzzle. It is equally important to understand the reasons behind sudden spikes and dips in cryptocurrency values. Therefore, remember to stay up to date on news stories surrounding the crypto market, because all the chart reading in the world can’t help you if a coin gets into a terrible news story.