

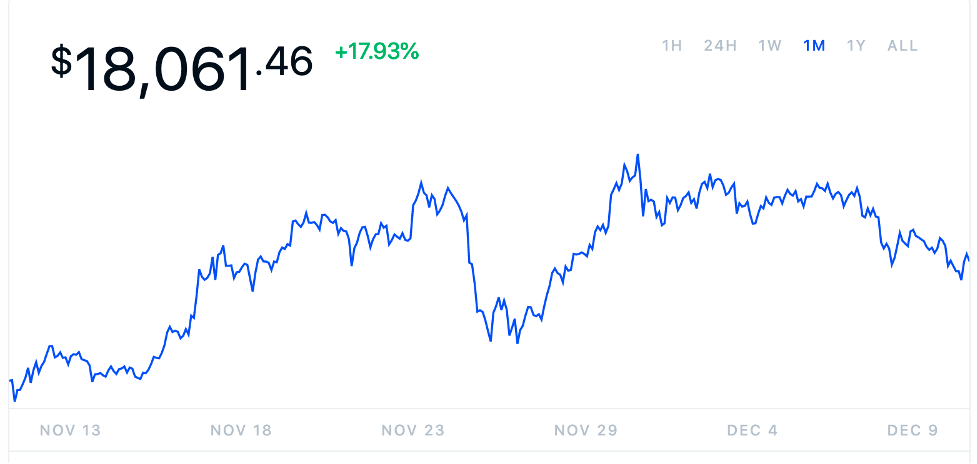
The price of Bitcoin (BTC) rallied from $15,446.82 on November 11 to $18,061.46 on December 11, 2020, for a 17.93% appreciation. Stocks also soared, what gives?
Contrarian Assets Like Bitcoin (BTC) Rally Alongside Stocks in December
Cryptocurrency like Bitcoin (BTC), Ethereum (ETH), Ripple (XRP), Tether (USDT) and Bitcoin Cash (BCH) are the top 5 cryptocurrencies by market capitalization. Bitcoin (BTC) holds the lion’s share of investments in digital currency, with a staggering $335 billion, followed by Ethereum (ETH) in a distant second at $62.5 billion, and Ripple (XRP) in third place at $26 billion. Viewed in perspective, Bitcoin (BTC) makes up 62.7% of the global cryptocurrency market (valued at $534 billion) which comprises almost 8,000 cryptocurrencies.
For many traders and investors, cryptocurrency like Bitcoin (BTC) is perceived differently to traditional financial instruments such as stocks, indices, currencies, commodities and the like. Cryptocurrency is a contrarian tradable option and investment security. It is extremely volatile, with dramatic price movements at any given time. Bitcoin’s performance in December was particularly startling to institutional traders and retail traders alike. The last time BTC approached $20,000, was December 2017. It dropped spectacularly in the years since, and has gradually appreciated towards its current level.
Despite sustained gains since 2017 (when it reached a peak of $19,783 per unit BTC), there are valid concerns that this is another flash in the pan for the world's premier cryptocurrency. The Guardian inked an op-ed, ‘Bitcoin Price Hits All-Time High of Almost $20,000’, and it addressed precisely the same concerns that many value traders were deeply concerned about: will the price of Bitcoin plunge after profit taking activity kicks in. This is typically the case with financial instruments, regardless of their category. Rapid price rises present enticing opportunities for generating outsized profits in double-quick time.
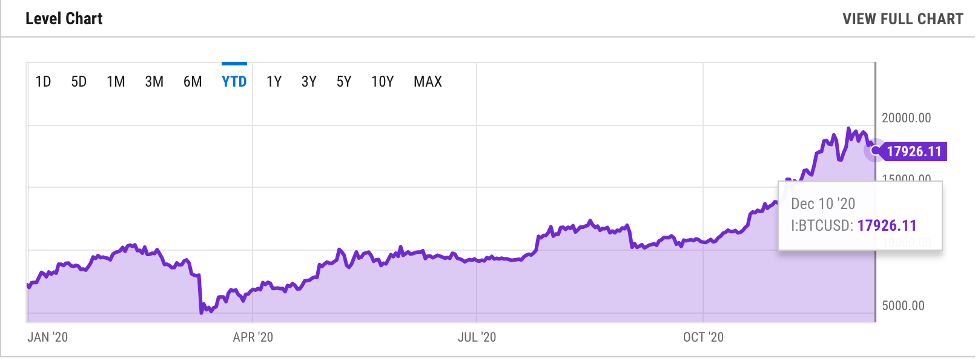
Graphs and charts of BTC's price performance are certainly reflective of speculative sentiment in 2020, but the all-time highs have been achieved from a much higher base level than they were in the run-up to the 2017 $20,000 Bitcoin peak. For instance, Bitcoin was trading between $10,000 and $15,000 per unit in the final stretch of December 2020, before spiking towards $20,000 per unit. In 2017, the same peak was reached, but from a much lower base of less than $5,000 per unit BTC. From a value-driven perspective alone, the current appreciation appears to be more sustainable. From barely a few cents per unit BTC back at inception in 2008, Bitcoin (BTC) is now regarded as a prime example of spectacular appreciation for an intangible financial instrument.
What Caused the Price of Bitcoin (BTC) to Rise in December 2020?
The Bitcoin price chart tends to indicate that the $20,000 per unit price ceiling remains intact, and that the pricing mechanism is trending lower. One would be remiss for assuming that Bitcoin’s peaks are reached in December, in tandem with the Thanksgiving, Black Friday, Cyber Monday and holiday shopping season. Indeed, it was December 2017 when the last $20,000 per unit price level almost occurred. However, in December 2018, BTC was priced around $3,800, and in December 2019, Bitcoin was around $7,500 per unit. The current performance of BTC dovetails perfectly with a rally in the stock market which has some traders and investors perplexed. BTC is widely regarded as an asset which performs similarly to gold. In other words, Bitcoin tends to rise when stocks are faltering, and it tends to fall when stocks are performing well.
A side-by-side comparison of BTCs pricing and that of the NASDAQ composite index makes for interesting reading.
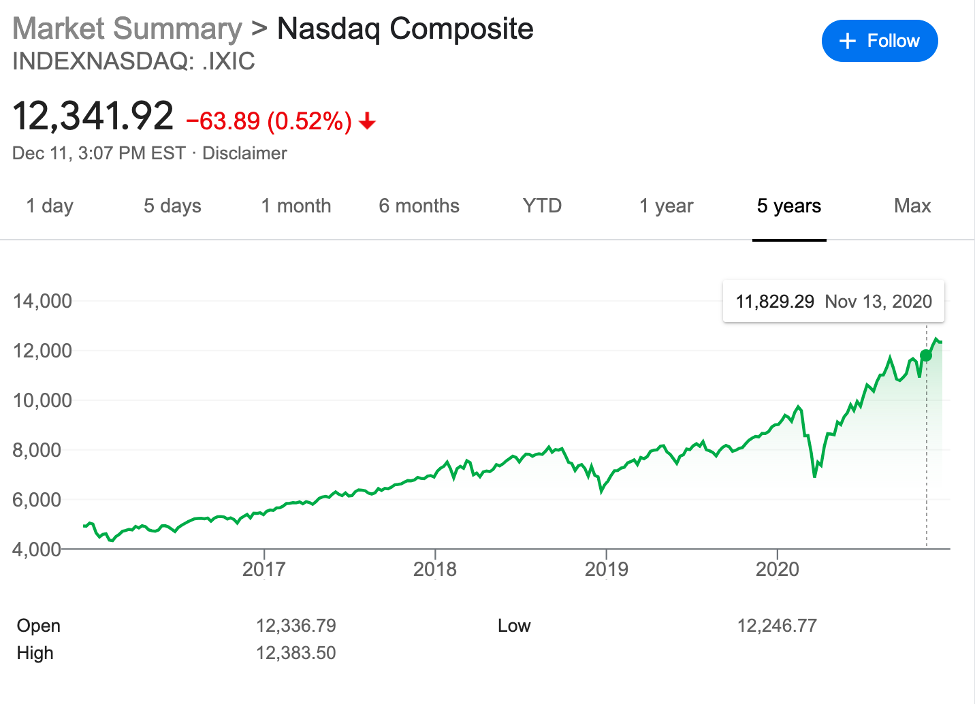
Indeed, there are similarities, but the 5-year performance of the NASDAQ composite index shows a near-uninterrupted trajectory of solid returns. The spectacular drops in the performance of the NASDAQ composite index are evident in February 2018, December 2018, and March 2020. At those same points BTC plunged spectacularly in February 2018, tapered off in December 2018, and dropped tremendously in March 2020. The price of gold is equally bullish, and mirrors the performance of the market in general. For these reasons, there appears to be a weak correlation between stock-market performance and the price of gold. Although, the consensus remains – gold is a solid hedge investment against market volatility, at least over the short-term.
Presently, BTC remains a viable prospect albeit in correction territory. From an equities perspective, the stocks to look out for at this time include a wide range of tech stocks such as Tesla Inc (NASDAQ: TSLA), Fuelcell Energy Inc (NASDAQ: FCEL), Palantir Tech Inc (NYSE: PLTR) and Corsair Gaming Inc. (NASDAQ: CRSR). The viability of stock options can change at a moment’s notice, given their inherent volatility. Heading into January 2021, with a switch from the Trump Administration to the Biden Administration, there is likely to be somewhat of a tempering in performance as markets await the balance of power from key races in Georgia, and the cabinet appointments made by President-elect Biden.
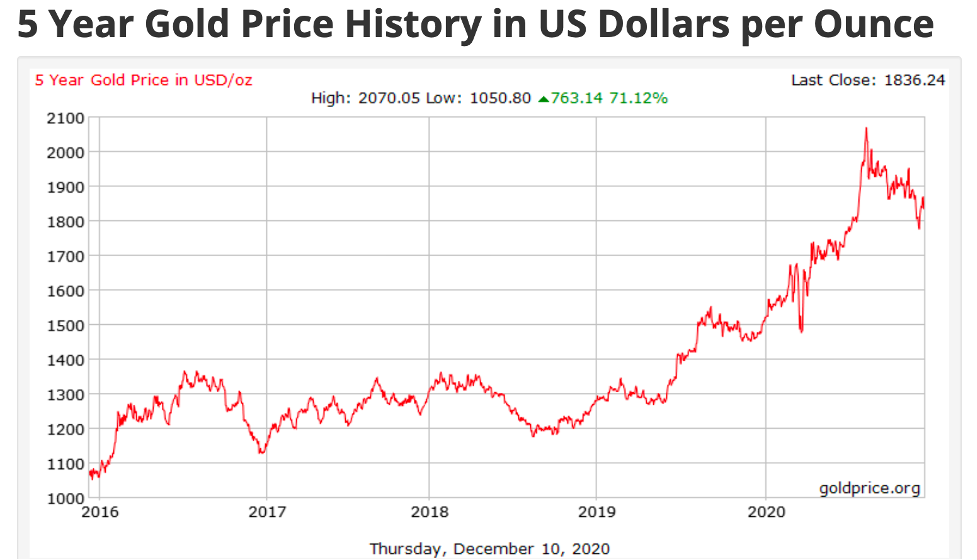
Stocks rose in December 2020 on the back of news that a vaccine for the novel coronavirus would be rolled out in short order, in tandem with talk of another massive US stimulus bill which would kickstart the economy and flood the markets with fresh cash ready to be spent. Midway through December 2020, the Senate approved a 1-week funding bill to prevent a government shutdown from taking place heading into the holiday season. This helped to temporarily rescue stocks which slid slightly on Friday, 11 December 2020. An important barometer of stock-market performance – the S&P 500 earnings multiplier closed at 26X earnings [Thursday, 10 December 2020], the second-highest in recorded history. As expected during a sell-off, the price of gold rose markedly, and touched $1,839.02 per ounce.
Between November 2020 and December 2020, equities markets rose, thanks largely to the US election, and the prospect of a divided Congress. With Republicans likely to hold the Senate and Democrats in control of the House and the White House, balance is ensured. Additionally, FDA approvals for Covid-19 vaccines have boosted prospects for a resolution to the pandemic which has crippled global equities markets, resulted in over 1 million deaths, and upended daily life for the entire planet. Overall, US-based SMEs posted strong quarterly gains heading into the final stretch of the year. While hospitality, energy, and airlines recorded losses, the combined performance of other industries was positive year-on-year.
Viewed in perspective, there appears to be a close correlation between the performance of cryptocurrencies and stock markets in December 2020. While traders and investors approach the markets from a different perspective – short-term versus long-term, there is clearly bullish sentiment fueling the crypto and stock markets at this time.