

Cryptocurrencies rose in price, with XRP leading the way. After the fall which began in April 2018, the digital asset gained 50% in price in just 3 days.
Are we seeing a repeat of last year?
The current situation reminds that of last year. From February 26, 2017 onwards, for the duration on 5 days, the volume of purchases of ethereum rose sharply, which exceeded the volume formed throughout the year.

Before that the second cryptocurrency by market capitalization followed a flat parth on the graph. In December 2016, the price was at the lowest point after which a bounceback occurred with a sharp rise in the volume of purchases. At the same time the, market capitalization index came out of the flat structure which has been forming for around a month:
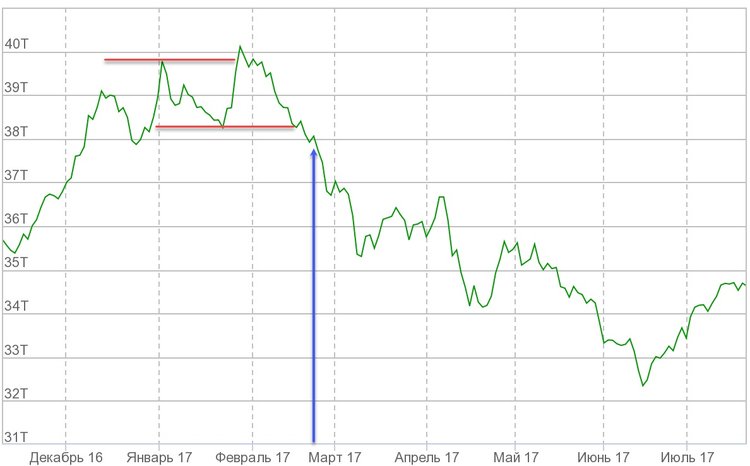
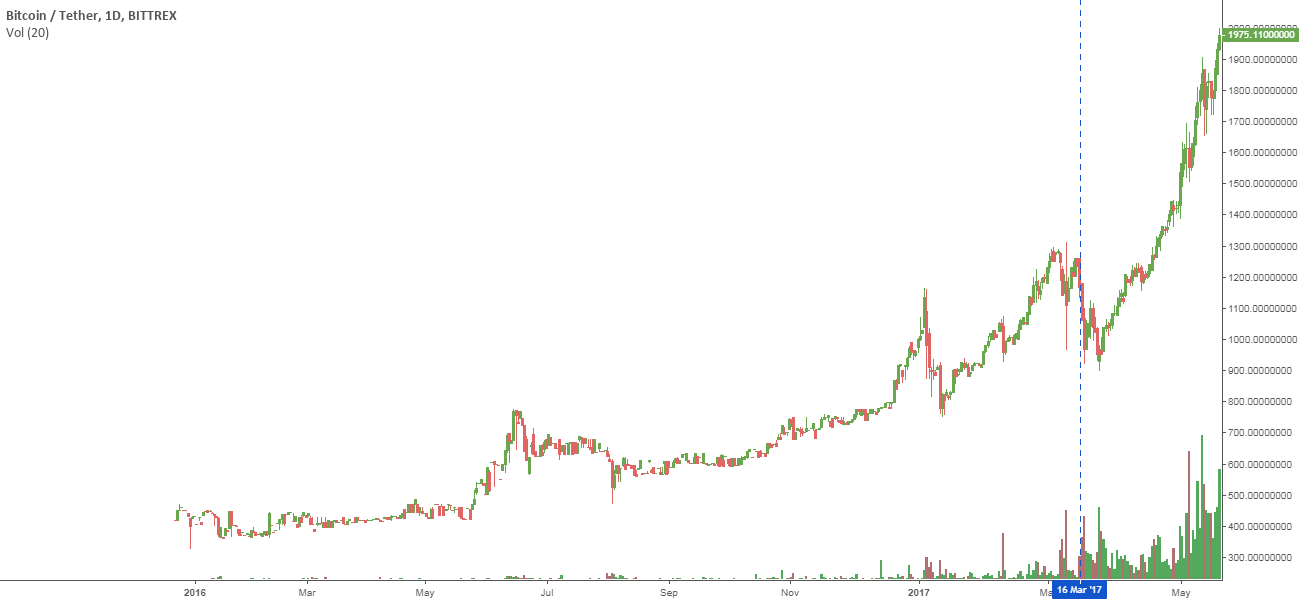
The price of ETH/USD was rising while the market capitalisation steadily decreased. The upward swing for many cryptocurrencies was started of by ethereum. Bitcoin purchase volumes rose only after half a month.
If comparing the graph of the overall market capitalization to the price of ethereum, the correlation in uncanny. As the index decreases, ethereum rose and vice versa.
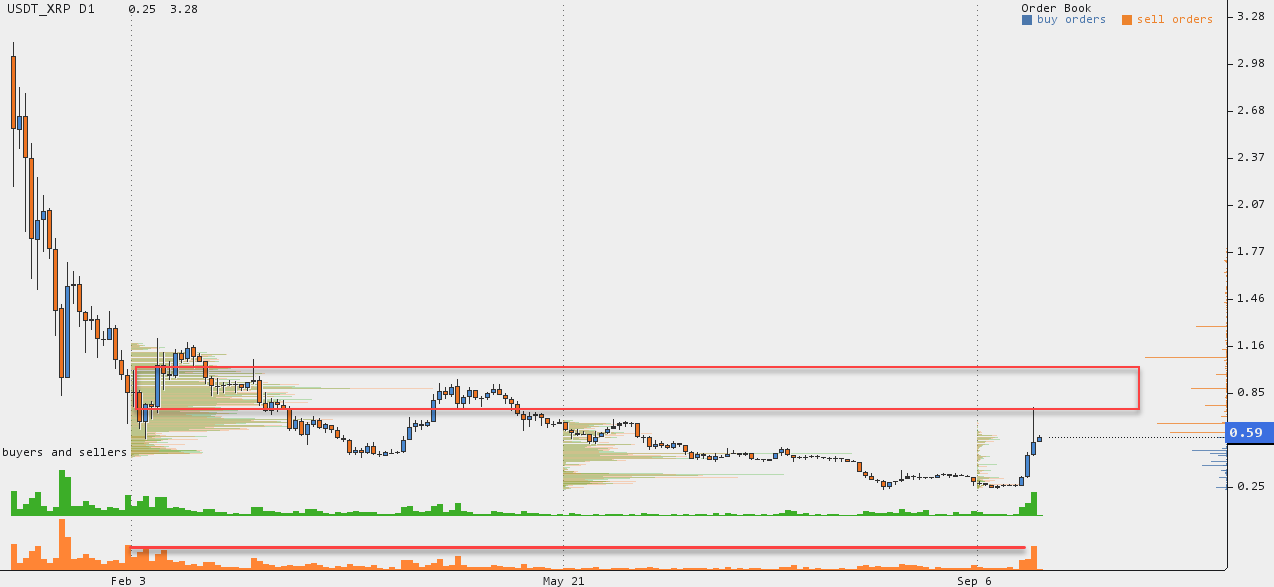
It looks like XRP is following a similar dynamic as purchase volumes rose sharply and overpassed the range seen in the past 7 months. The price reached the high volume area which formed in the February-March this year.
According to the index of the market, a flat was formed.
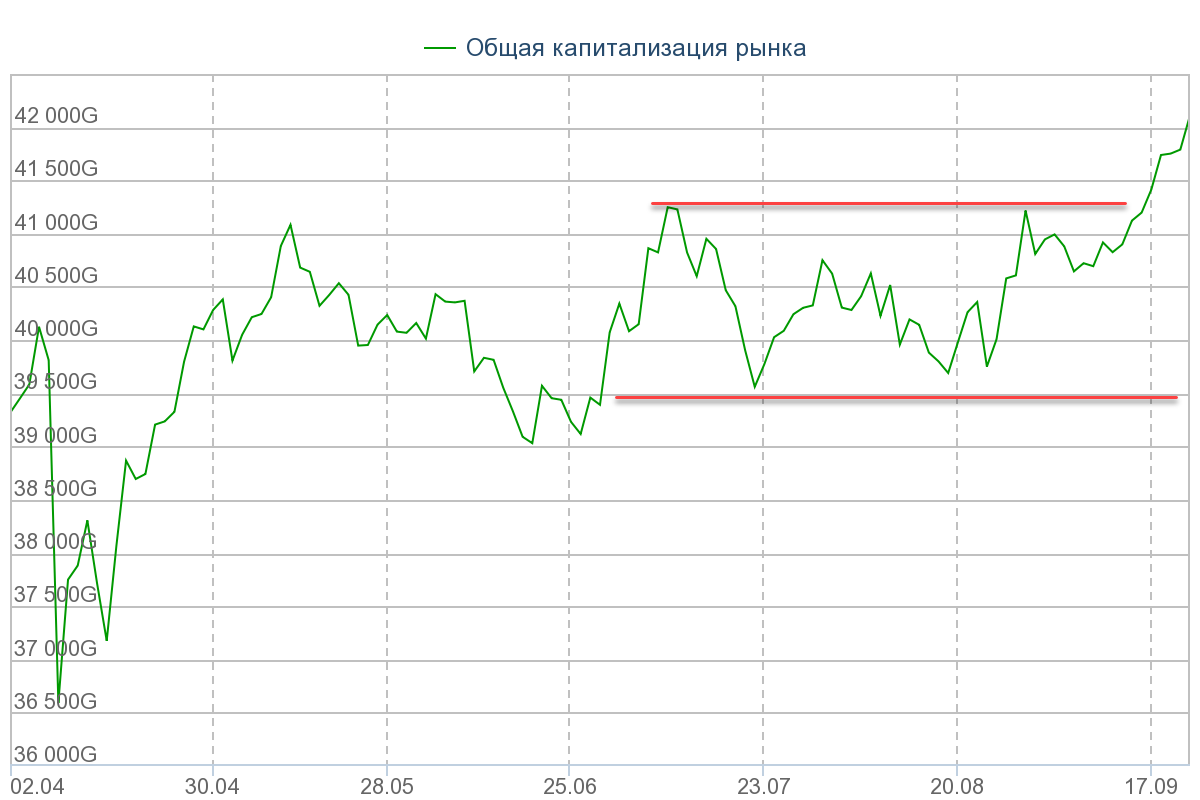
The top end of the flat is now punctured and the upward movement can continue. But most often than not after going through an important milestone, the price does come back down eventually. For more convincing growth, the index has to correct itself and fix at around the 41 trillion. But everything is ready for the index to fall.
The volumes of bitcoin purchases have not shown a significant increase as of yet. As it was anticipated, there was a false rise at $6,150 and then a movement to the $6,800.
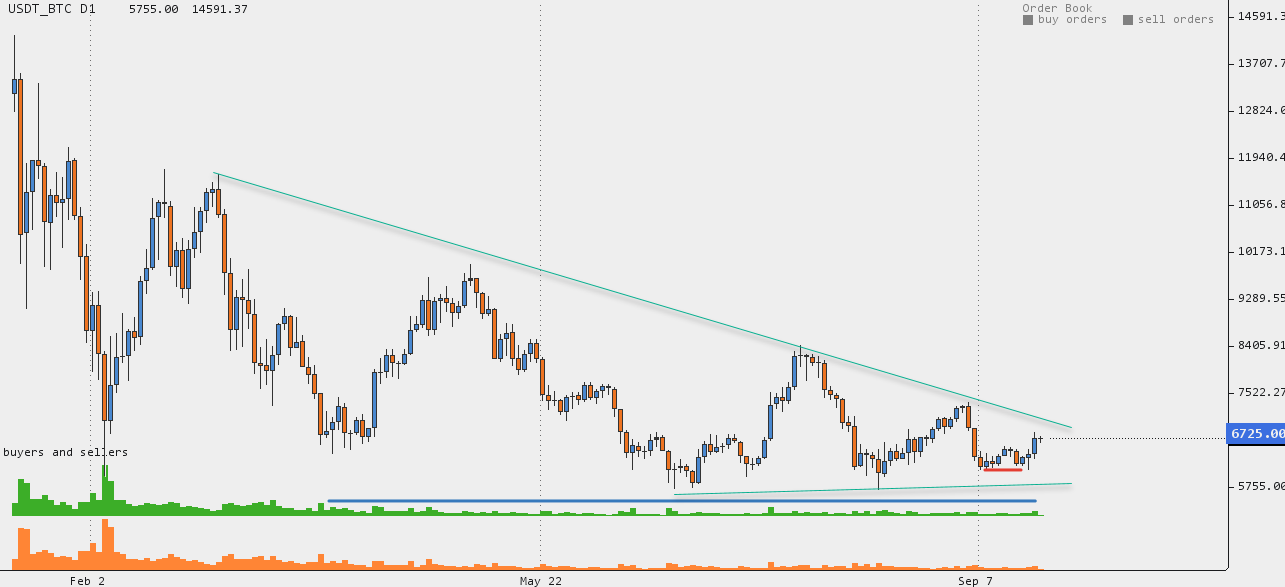
In a classical technical analysis, the movement form February 2018 up till now resembles a narrowing triangle. Traders that are using this are getting themselves into a trap since a triangle is a version of a flat. A flat does not end with a puncture of the top of a triangle. In this case, the likelihood of the price returning to the flat is high.
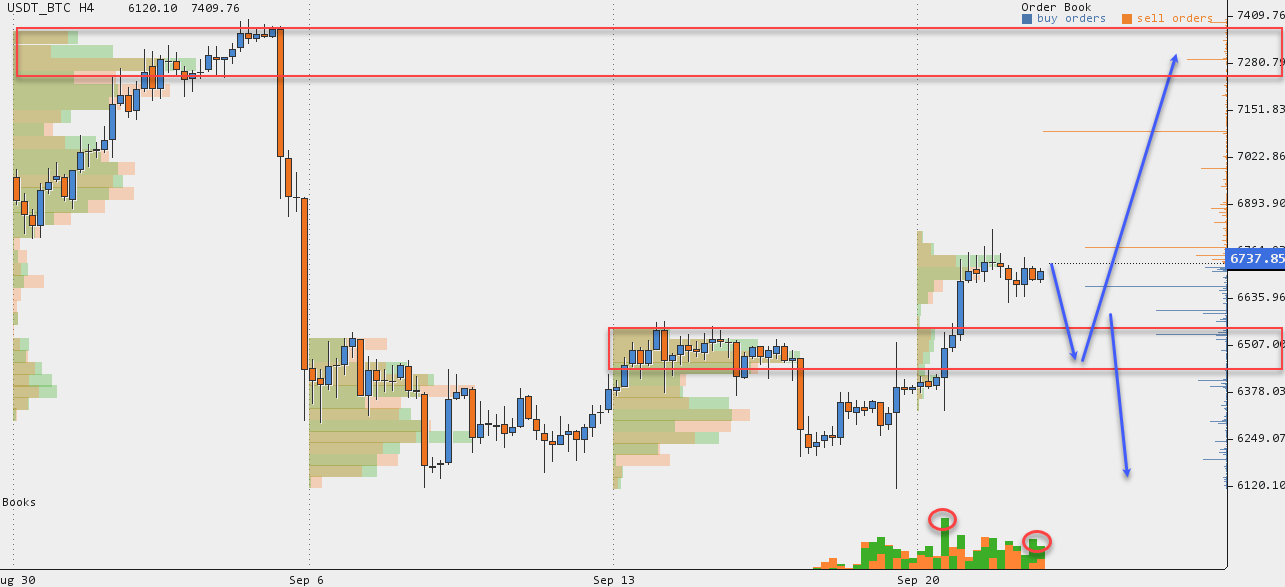
For a more substantial growth of the price, bitcoin needs to fix at the top part of the flat in the region of $7,500 with the structure of the trend remaining the same. Big buyers are at $6,5000 and that point makes up the maximum peak for the correction of the current rise. For the past few days, demand overshadowed supply. If a reversal to the $6,500 takes place and the fall does not continue, then the rise will occur to at least $7,300.
The latest fall of the ETH/USD was not reversed. When the downward wave got to $190, the rebound occurred and so the demand increased. A substantial demand then appeared and the price rose to $250.

The purchase volume that increased the priced to that level, will for the basis for the trend which we seen from $164. Ethereum price can correct all the way down to $200. But if the advantage remains with the buyers, then the price can u-turn at this point and continue to grow to $280-300.
It looks like that news about PNClaunching a payment system on XRP and the announcement of the upcoming xRapid has positively affected the XRP/USD rate. XRP price reacted a day after the nes and then corrected slightly.
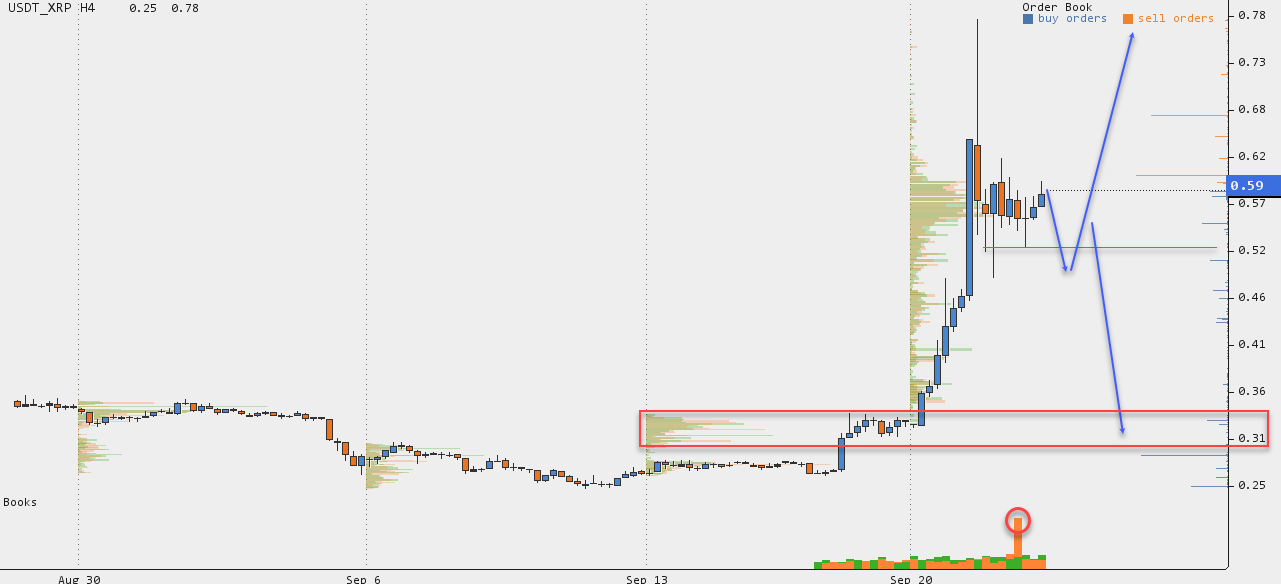
Regardless, with favourable conditions, a rise in demand was seen. This could have been a big buyer accumulation a position at around $0.30 who then sold everything off when the price doubled. Or this could have been a tactical move and the buyer will soon recoup the position, but for now the price will follow a short-term flat with the low border of that becoming a crucial point. If the price does u-turn to $0.5 then the rise will continue.
Bitcoin cash price reached the peak of the correction from $660. Upon reaching $500, the buyers which came in at the start of September, have sold off and left without making a loss. That’s why a downward rebound has occurred.
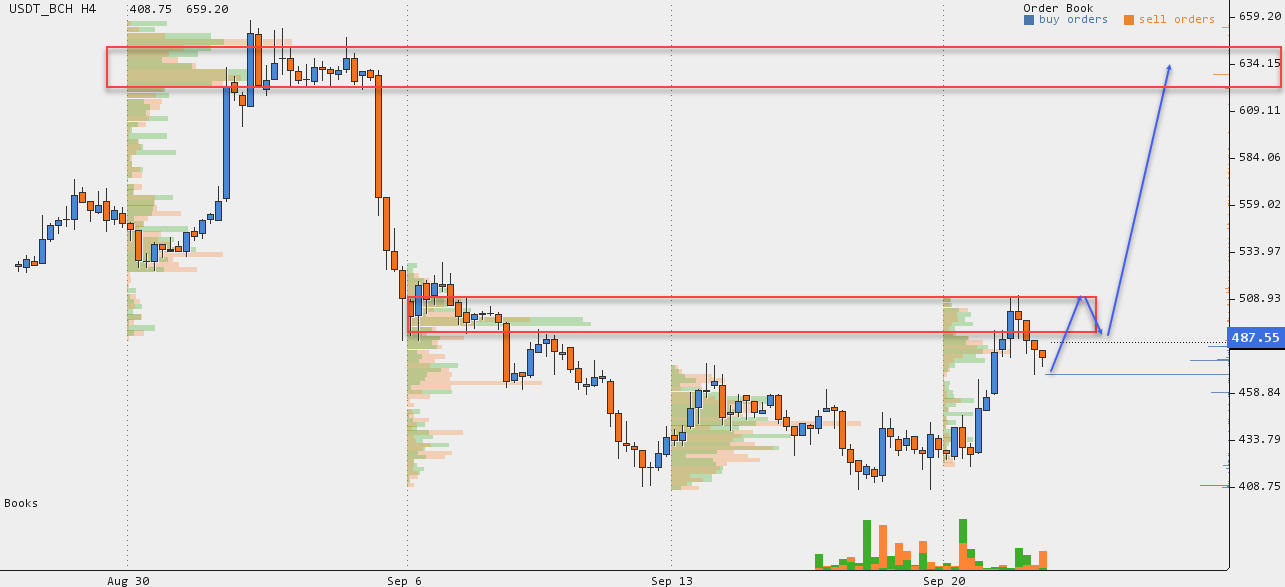
Therefore, in order to upkeep the upward trend, BCH needs to smash that boundary. For the rise to continue, buyers have to dominate the scene and this could happen at around the $500 area..