As BTC has gone off on the biggest tear in history, there’s much speculation about where it will go next. $100k this year? $500k next year? It’s fair to say that the bullish voices currently outweigh the bears.
But where is the big money coming from, and what can this tell us about what to expect from price action?
Most analysts and experts concur that this bull run is fundamentally different to the 2017 rally due to the type of investors entering the market. The 2017 run was characterized by the inflow of investment from individuals, accompanied by the ICO frenzy. This time around, market caps have risen high enough to draw in institutional investors, who wield far more financial clout than the retail markets. The net result is an unprecedented demand for liquidity.
A Slow Burn, Not a Mad Rush
Although it may seem like a relatively new phenomenon, institutional investment has been slowly ramping up for the last year or two. A report published by eToroX in January 2021 found that the earliest institutional movers in 2020 were, perhaps predictably, smaller and leaner funds.
More recently, towards the end of last year, the interest came from high-net-worth individuals, family offices and a small number of financial institutions. The report, which collected its data in late 2020, also flagged that institutional respondents indicated that the market cap was the single biggest draw for investing in cryptocurrency, meaning that institutional interest is likely to remain as long as prices are high.
Given that high prices are an inevitable consequence of institutional involvement, then it seems unlikely we’ll see a return to a sub-$20,000 or even sub-$50,000 BTC at any time soon.
The eToroX report also highlights a strong preference for regulated markets and exchanges and OTC platforms for traders and traditional custodial banks for custody services among the respondents it surveyed. Therefore, the news from the first quarter of 2021 bodes well for future institutional adoption. Large traditional banks, like Deutsche Bank, BNY Mellon and Goldman Sachs, have all recently indicated they’re moving into cryptocurrency. The news will provide a huge boost in trust and reputation, helping to further stimulate institutional adoption.
Fundamental Forces at Play
The numbers also back up the view that regulated platforms are gaining traction. For a long time, the cryptocurrency derivatives markets have been dominated by unregulated offerings from crypto-native firms like OKEx and Binance. However, data from The Block indicates that the open interest on regulated platforms like CME has trebled in 2021, underscoring the sentiments of the eToro respondents.
While the size of institutional trading is one factor pushing up prices, it’s also worth considering the role Bitcoin’s economic model plays. Because BTC supply is limited by design, any increase in demand pushes up the price. However, "supply" has many subtleties that go beyond the number of minted BTC.
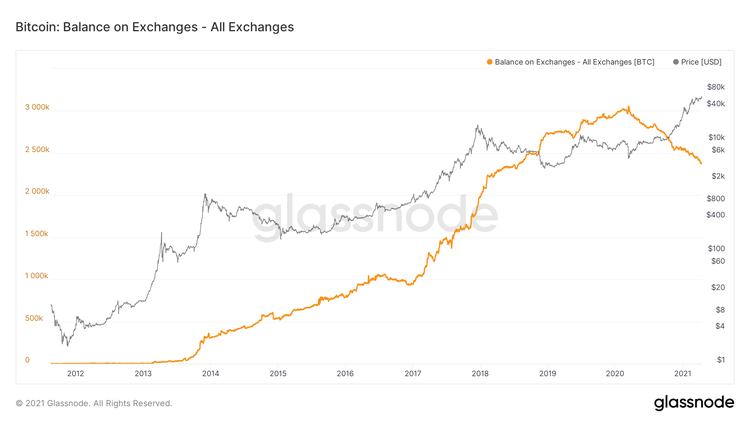
Data from Glassnode reveals that BTC is currently undergoing an epic supply squeeze. Firstly, the balance available on exchanges has been steadily declining for over a year now. In fact, exchange liquidity now is around the same level that it was in August 2018 in the depths of the crypto winter.
Furthermore, Glassnode data also indicates that miners have stopped cashing out their block rewards, choosing instead to HODL. There’s little doubt that this is because they believe prices will keep increasing, and it makes more sense to hang on before selling.
However, with exchange balances lower and miners hoarding, meaning that newly-minted BTC isn’t entering the market, the squeeze doesn’t show any sign of abating soon.
Therefore, it may not need a huge mass of institutional inflow for BTC prices to start skyrocketing, as there’s such a limited amount available to meet demand.
The Rules of Cycles Still Apply
It’s important to remember that Bitcoin prices tend to move in cycles, closely correlated to the halving events. The 2016 halving saw prices increase 3,000% from $650 to $20,000 before falling back. However, the timeline for that run was around 18 months.
At the time of the last halving, in May 2020, BTC was trading around the $8,500 mark, and that was under a year ago. So it’s likely that we’ll see plenty of further action during this halving cycle before any pullback. Quant analyst PlanB, the creator of the Bitcoin stock-to-flow model, believes that we could even be on track for a $500,000 BTC before the end of this bull cycle, with a $288,000 price before the end of this year.
Whether or not that pans out remains to be seen. However, with strong economic fundamentals combined with the ongoing entry of institutional players, it seems almost certain that we can expect plenty of further bullish action from BTC for quite some time to come.


